Market Observations
It was perfect that I wrote a post last night defending market action as slowly basing and today that idea gets pushed to the very max. The S&P 500 closed below 1230 and that is a key number to me. The close was at the very bottom of the upper rectangle I charted last night. The very bottom. A lack of more help from the FED and plenty of rumors of bank downgrades made the session very nervous. Important end of week coming up.
A Look at Longer Term Charts
Tonight I wanted to post a bunch of weekly charts with the very minimum of commentary. For most shorter term trades I will ONLY use daily charts. I find them the most predictive in the near term. Weekly charts are better for trying to see long term trends as well as key moments and price points for any index or stock.
Terms:
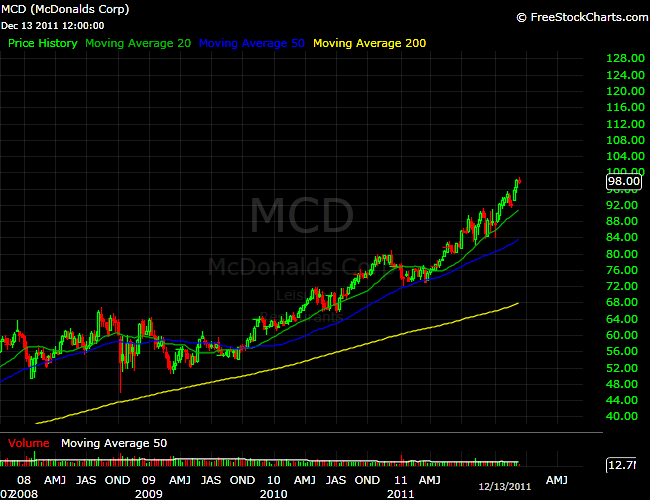
20 MDA = GREEN Line
50 MDA = BLUE Line
200 MDA = YELLOW Line
Click on any chart for a larger view.
Gold (GLD)
Gold is coming down to the 50 which is around $1550 or so in price. No terrible damage as yet, but that is some pocket to the 200. (Disclosure: Long gold in long term account for many years):

Silver (SLV)
Silver has been badly damaged, dropping below both the 20 and the 50. What's worse is the 20 has crossed below the 50 which usually hints at more weakness ahead. Support is way down in the $23 range. (Disclosure: Long silver in long term account for many years):

SP 500
Coming down to the downward sloping 200. The cross of the 20 past the 50 is a bad sign and the recent touch of the 200 mirrors the action from 2008-2009. Very dangerous right here:

Nasdaq
The Nasdaq is showing the same 20 cross past the 50, but this weekly is no where near as dangerous as the SP 500:

MacDonalds (MCD)
This one does not seem to be moving like a stalwart but more like a Dot Com stock! I think this has to slow down, right? (Disclosure: Long MCD for many years in long term account):
Amazon (AMZN)
The ultimate retailer. I buy almost everything from this place. On the weekly the abruptness of the recent drop is only matched by the drop in late 2008. This is a favorite stock of many so the selling more disturbing. The 20 has just torqued down very hard:

Apple (AAPL)
The world's favorite stock is showing that discussion of it's death may be very premature. AAPL could drop to $360 before I would get worried:

Google (GOOG)
Plenty of eyes on this one as of late. Solid weekly chart here. (Disclosure: Long GOOG in long term account since 2008, and yes I held from $500 all the way to $250 and back):

Lululemon (LULU)
Note this is an expanded DAILY chart as most of the action for this name has come in recent years. This one is showing signs of serious trouble, breaking under the 200. LULU is now tracking the 20 lower and has been rejected there twice in a little over a week. Former high flyer will need a bid soon and hold $42:

It's a mixed bag. The SP 500 is the most concerning as far as general market direction near term. There is still plenty of strength in the market as well. What are you looking at going into years end?
Have a good night.
5 comments:
I confess I am not much for the stock market (as in, following with great understanding) but I read somewhere that Apple was supposed to be on the downside. Apparently not. I'm sure it will spike again if the rumors are true and the iPad3 comes out next February.
Hey Alex! Thanks for the comment. Its very much in flux right now with some of the big leaders like Apple.
This was a cool post. I've always wondered what stocks you've bought but thought it would be rude to ask.
Tell you anytime, just shoot me an email.
Tell you anytime, just shoot me an email.
Post a Comment