Hello out there! Yes, I am alive. I have been super busy with the new job (love it!) and have taken a long break from posting or market work to be focused on the new gig. I did want to pop in tonight and post a quick chart and some thoughts I have as we could be on the eve of a new round of some kind of Quantitative Easing, Twist, Running Man, or whatever dance move the Fed would like to name it.
QE and the Trap of Diminishing Returns
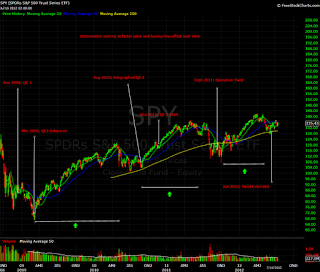
First off, the chart of SPY and interventions notated (click for larger view):
Some quick points:
-The time from QE/Intervention application to when market faces trouble is getting smaller over time
-The almost fractal like repeat of the pattern is worth noting as the arcs get smaller (three shown above)
-Fed support for market is coming at progressively higher prices
-The time from when SPY closes below the 50 MDA until Fed action is getting compressed (they chartists over there?)
My take away from this chart (been looking at it a bit lately) is that there is considerable interest by the Fed and extension Wall Street in limiting any damage to equity markets. I know, shocking right. I think besides that obvious point what I take away from this is the Law of Diminishing Returns is clearly at work. I could go on and on but seems at this point the setting of a absolute floor under the SPY and a general area of a top end target would be more effective and up front than the current process of trying to calm "panic" when stocks fall.
Long time readers know I am against QE and most market support by the US Fed. By a fortuitous meld of circumstances the kind of support the markets are getting keeps on trucking. My question is how many more and how much more is going to be needed with compression of the price reaction getting smaller?
Have a good night.
